
What Happened in 2015? (Landscape Edition)
go.ncsu.edu/readext?474977
en Español / em Português
El inglés es el idioma de control de esta página. En la medida en que haya algún conflicto entre la traducción al inglés y la traducción, el inglés prevalece.
Al hacer clic en el enlace de traducción se activa un servicio de traducción gratuito para convertir la página al español. Al igual que con cualquier traducción por Internet, la conversión no es sensible al contexto y puede que no traduzca el texto en su significado original. NC State Extension no garantiza la exactitud del texto traducido. Por favor, tenga en cuenta que algunas aplicaciones y/o servicios pueden no funcionar como se espera cuando se traducen.
Português
Inglês é o idioma de controle desta página. Na medida que haja algum conflito entre o texto original em Inglês e a tradução, o Inglês prevalece.
Ao clicar no link de tradução, um serviço gratuito de tradução será ativado para converter a página para o Português. Como em qualquer tradução pela internet, a conversão não é sensivel ao contexto e pode não ocorrer a tradução para o significado orginal. O serviço de Extensão da Carolina do Norte (NC State Extension) não garante a exatidão do texto traduzido. Por favor, observe que algumas funções ou serviços podem não funcionar como esperado após a tradução.
English
English is the controlling language of this page. To the extent there is any conflict between the English text and the translation, English controls.
Clicking on the translation link activates a free translation service to convert the page to Spanish. As with any Internet translation, the conversion is not context-sensitive and may not translate the text to its original meaning. NC State Extension does not guarantee the accuracy of the translated text. Please note that some applications and/or services may not function as expected when translated.
Collapse ▲As a follow up to our last post on golf course sample data, here are the stats for all of the turfgrass samples that were submitted to the NC State Turf Diagnostics Lab from landscape settings in 2015.
Unlike golf course samples that come from all over the country, landscape samples are exclusively from the state of North Carolina. However, just like golf course samples we typically only receive samples from cases that are hard to diagnose in the field alone. Therefore these charts don’t necessarily represent all of the major disease outbreaks, but illustrate what warrants professional diagnosis by a lab. In addition, these data only represent physical samples submitted to our lab. Next year we will include digital diagnoses as well.
As most turfgrass managers know, North Carolina is located in the transition zone. Therefore, we grow most of the cool and warm-season turfgrass species throughout the different regions of the state and that is reflected in our data.
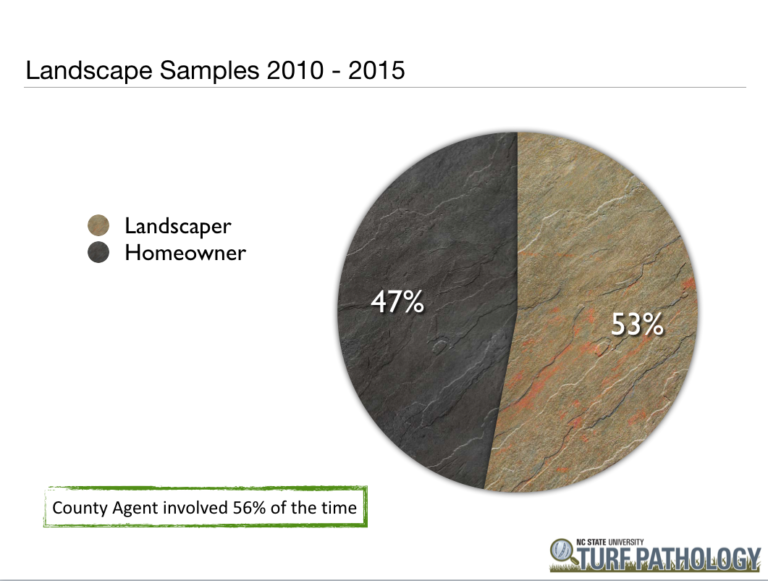 The chart above covers the past six years showing that landscape submissions are relatively evenly divided amongst homeowners and landscapers. County extension agents were involved 56% of the time with assisting in diagnosis and submittal of physical samples.
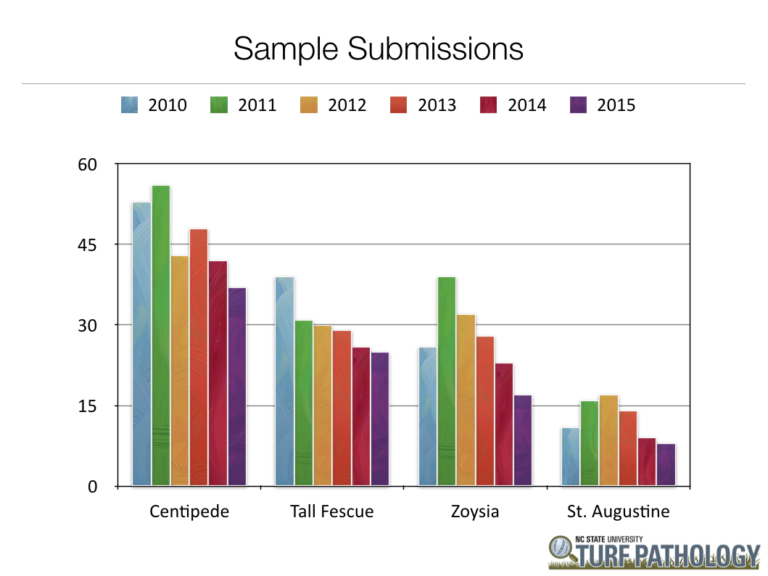
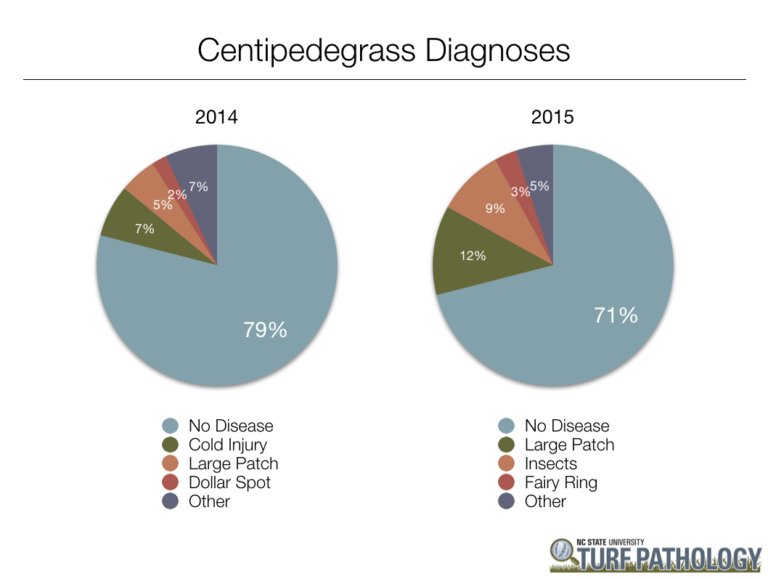
Centipedegrass remains the top species submitted every year. Overall, physical sample submissions are going down. This is due to an increase in digital submissions of images for diagnosis since the common diseases of landscape turf can often be diagnosed via image only.
 The top four are typically centipede, tall fescue, zoysia, and St. Augustinegrass each year. The other category includes Kentucky bluegrass, bermudagrass, ryegrass, and fine fescues.
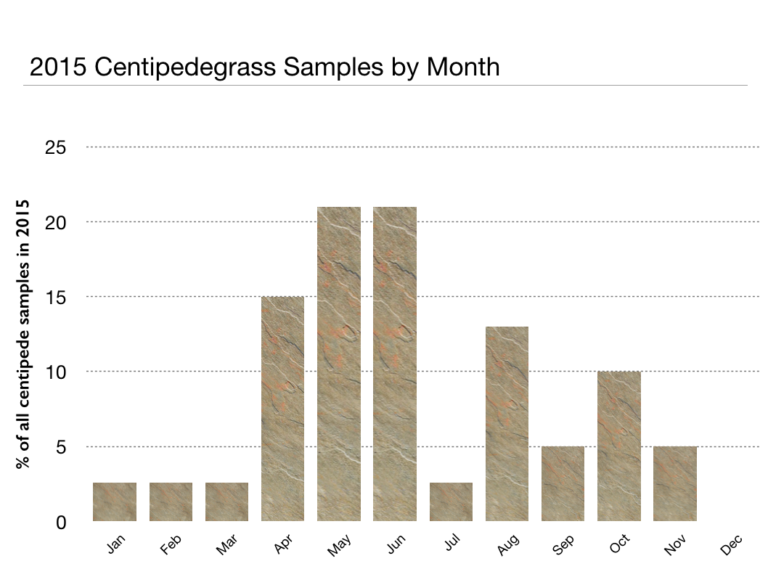
As with most warm-season turfgrasses, centipedegrass sample submissions are the highest in the spring and fall. The overwhelming majority of the time a disease is not to blame. As most centipedegrass managers know, turf quality is often best with minimal inputs and care must be taken when using herbicides and fertilizers.
For more information about centipedegrass management, click on the link below.
Centipedegrass Lawn Maintenance Calendar
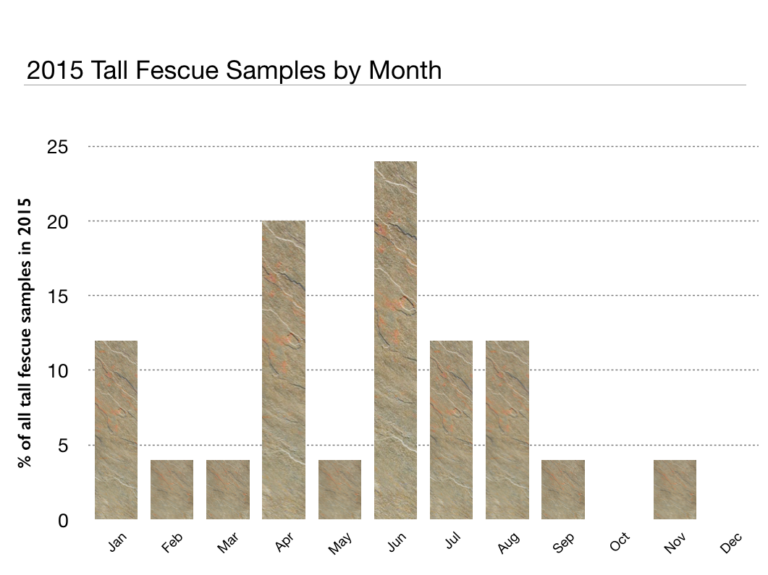
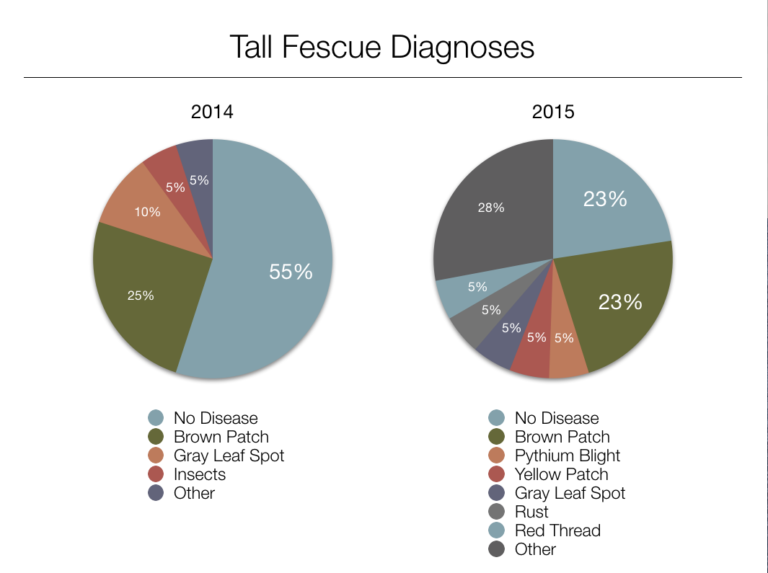
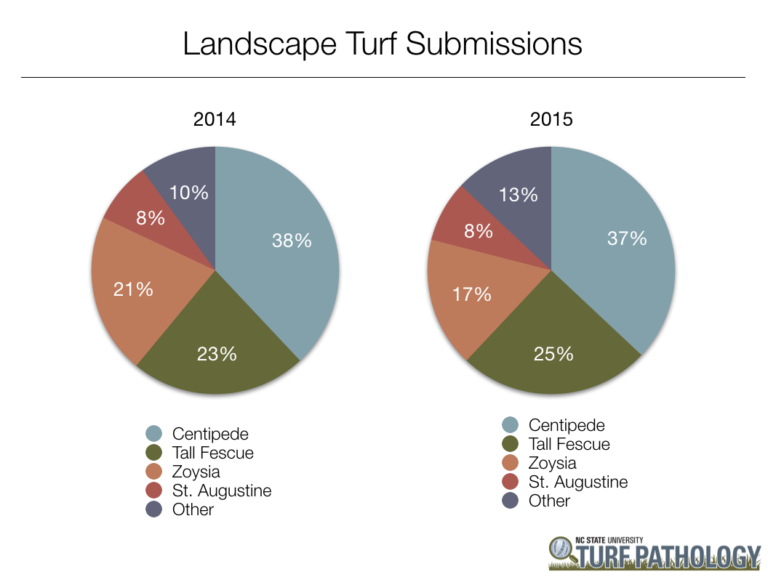
The spike in January of 2015 was due to an outbreak of yellow patch and the majority of samples in April were due to cold injury. Specifically it was on March 29 when the low was recorded at 22 degrees F after several weeks of temperatures in the upper 60’s and lower 70’s that caused tall fescue to turn yellow uniformly across most lawns. 2015 also saw a wider variety of diseases due to a wetter/warmer year. The large “other” slice of the 2015 pie includes cold injury, insects, chemical injury, etc.
For more information about tall fescue management, click on the link below.
Tall Fescue Lawn Maintenance Calendar
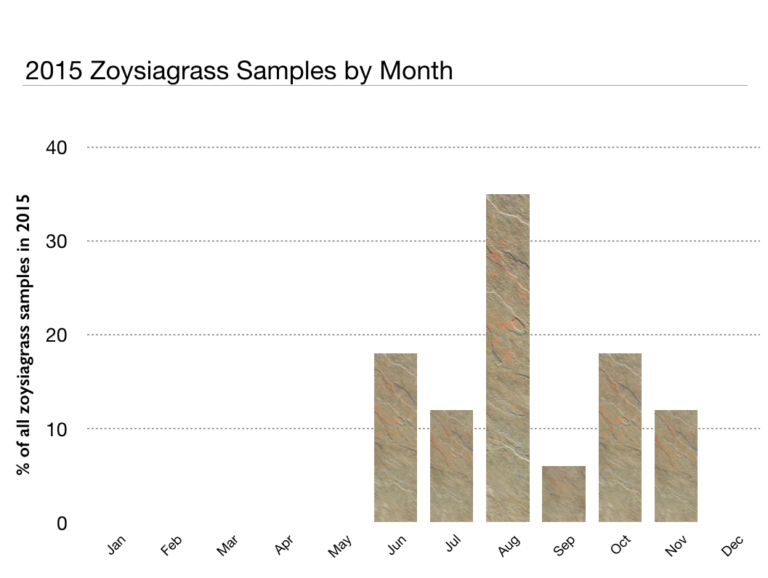
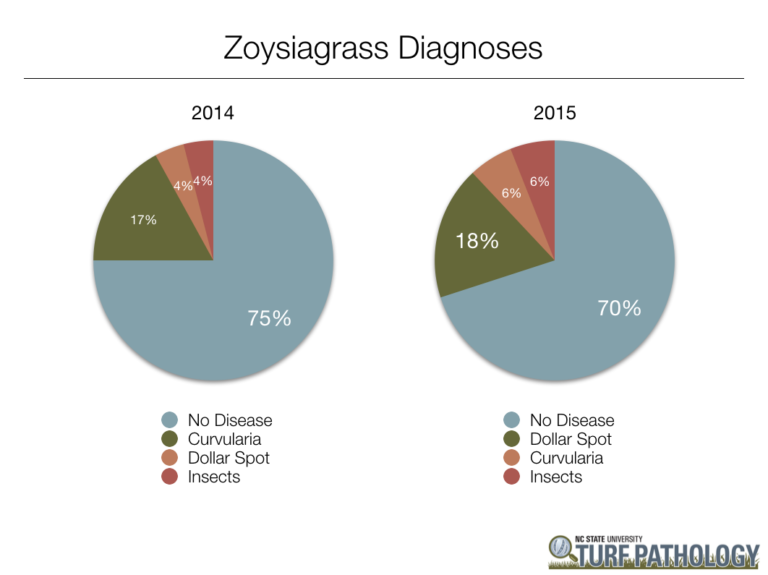 All of the zoysiagrass samples were submitted during the summer and fall. The majority of the time a disease was not to blame and every year folks are curious to know what’s causing the black patches (see image below) in their dormant lawns. These are caused by a fungus (Curvularia sp.) that is acting as a saprophyte, however damage can be significant in the spring of the year at green-up if the lawn is severely scalped and weather conditions favor the pathogen. We typically do not recommend fungicide applications for this disease and encourage managers to go easy with their first few mowings until full green-up has occurred.
Finally, you may be wondering why large patch (a.k.a. zoysia patch) is absent from the pie chart. While we do diagnose it, it’s rare that we receive physical samples. The majority of those are diagnosed via digital submissions or in the field by expert landscapers.
For more information about zoysiagrass management, click on the link below.
Zoysiagrass Lawn Maintenance Calendar
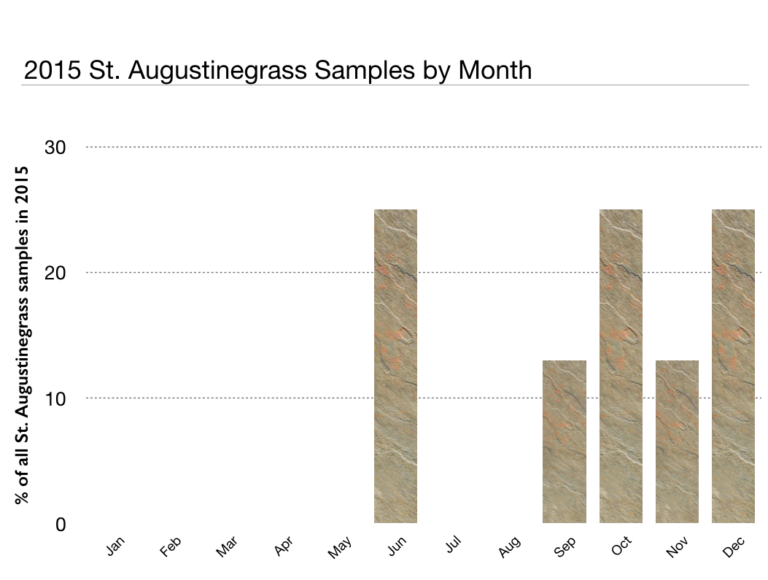
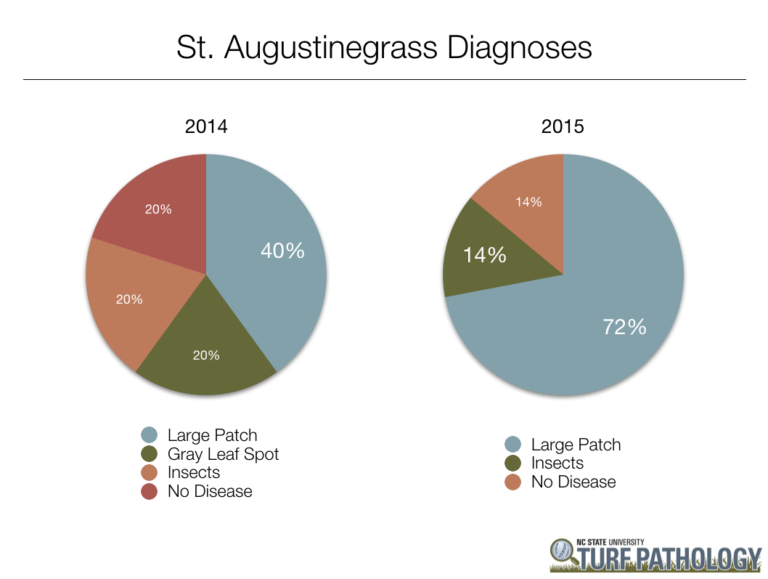
Finally, the majority of St. Augustinegrass samples were diagnosed late spring/early summer and in the fall. As you can see from the pie charts, it’s usually due to large patch or insects. Gray leaf spot damage severe enough to warrant treatment is typically limited to newly sodded or young stands of St. Augustinegrass.
For more information about St. Augustinegrass management, click on the link below.